Digital engineering solutions tailored to your needs
HydroWeb provides water professionals and operators with data-driven insights and predictions to plan and act with confidence. The platform facilitates intelligent management of water system performance and leverages our industry-leading real-time control solution, Csoft®, to optimize complex water systems.
Benefits
Centralize Data
Integrate and centralize data to provide exponential benefits and collaboration. Break silos and create a shared view of the current state and the way forward to reach your objectives swiftly.
Real-Time Insights
Powerful analytics from Geographic Information Systems (GIS) to artificial intelligence (AI) and 3D digital twins help you understand your data and forecast what’s to come.
Act With Confidence
Transform decision-making from reactive to predictive with data-driven insights to better manage risks and compliance.
Improved Efficiency
Reduce costs through automated process, system optimization, and early anomaly detection. Foster workforce development and knowledge transfer.
Engage
Scalable
Solutions
HydroWeb is an integrated and intelligent platform to collect, analyze, and manage water system data. This intuitive web platform combines science and engineering expertise with advanced analytics and technology, enabling our clients to protect and manage valuable water resources around the world. Our interdisciplinary teams collaborate with our clients to create customized and scalable digital solutions. HydroWeb can be customized to support smart data collection, advanced analytics, and automated intelligent processes within a secure cloud environment.
HydroWeb builds on more than 20 years of implemented value-generating and pragmatic solutions that have addressed the most challenging problems for water, environment, and sustainable infrastructure programs resulting in optimized performance and reduced asset costs.
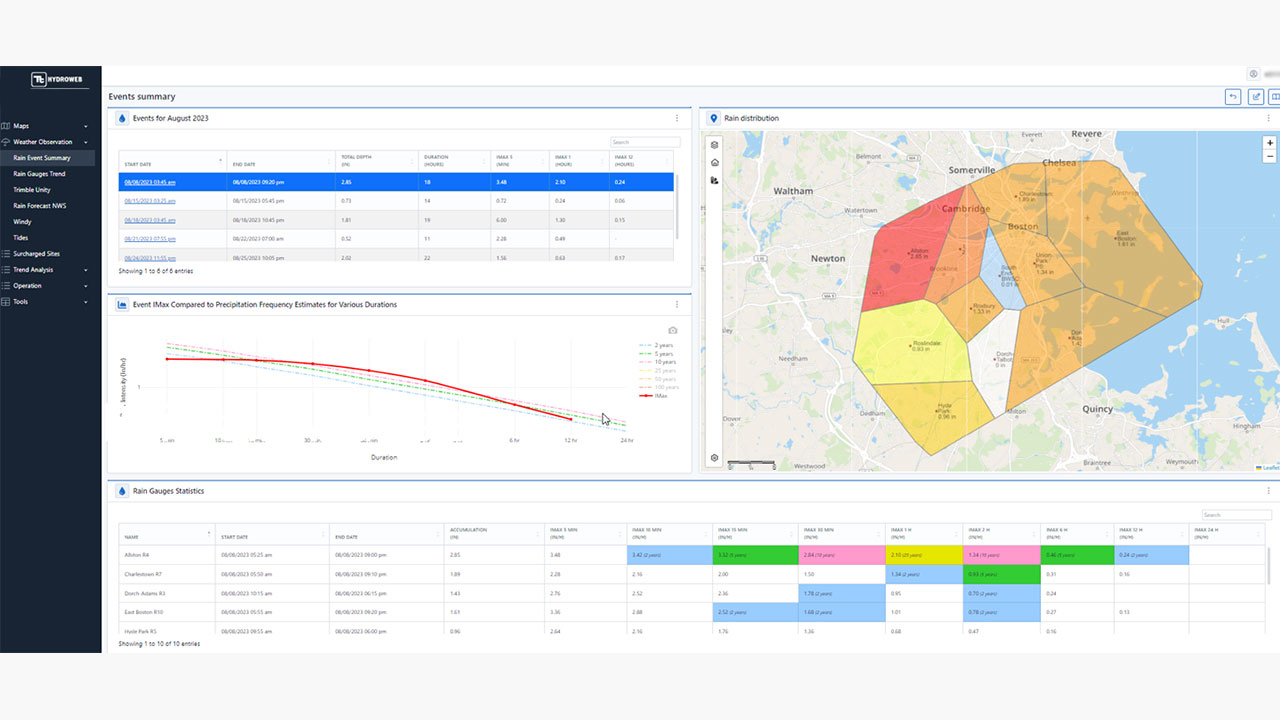
Rainfall Analysis
- Automated rainfall statistics – Automate the process of post-event rainfall analysis including rainfall return periods.
- Real-time storm tracking – Live updates and integrated graphic display of radar images, rain gauges, Thiessen polygons, and isohyetal analysis.
Collection Systems
- Data integration – Automate the process of data collection and unification of data from various sources into one single platform with georeferencing so data is contextualized efficiently.
- System performance tracking – Actively monitor and track system performance using machine learning to classify flows and perform trend analysis to detect and address issues quickly.
- Storm impact prediction and analysis – Provide system level and flow predictions using digital twins and machine learning, automate correlation with rainfall and system data to analyze overall performance, and predict pollution events.
- Integration of modeling tools – Automate model data validation, scenario modeling, and solutions optimization, and visualize results for analysis and comparison.
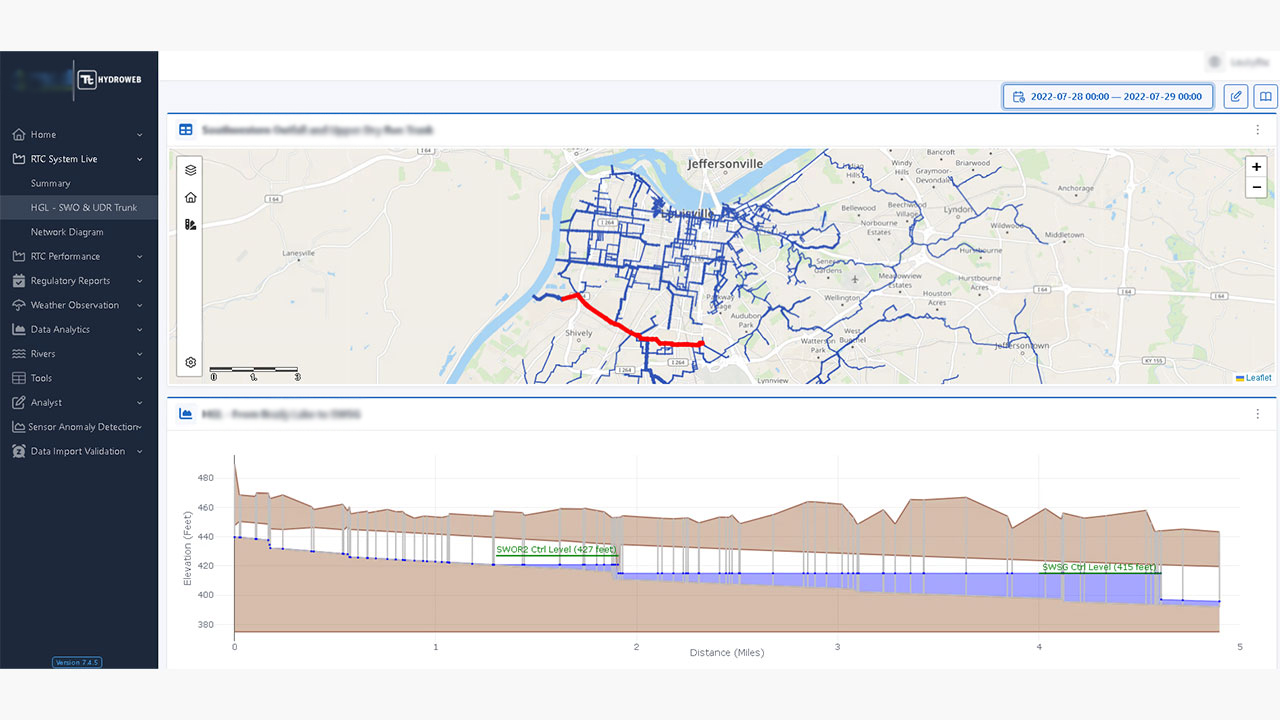
Intelligent Water Management with Csoft®
- Intelligent control – The award-winning Csoft® module provides predictive, systemwide, and coordinated real-time control to sewer networks efficiently, reliably, and safely.
- System optimization – Maximize the use of conveyance, storage, and treatment capacities to adapt to changing conditions.
- Cost savings – Reduce capital expenditure while meeting environmental objectives.
- Improve water quality – Reduce sewer overflows, regulate and balance inflows for treatment with quick reaction time.
- Build community resiliency – Forecast wet weather impact and reduce risks of flooding.
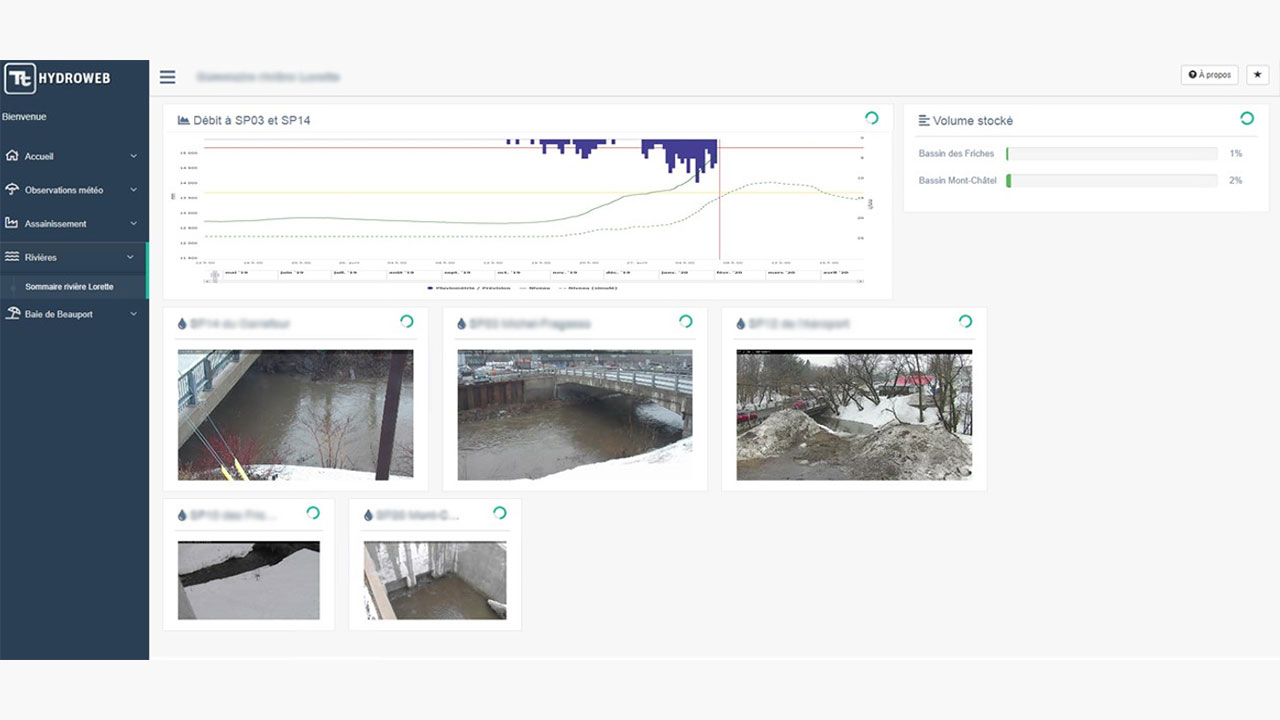
Flood Warning
- Reliable data – Integration of real-time monitoring data and video feeds for accurate representation.
- Digital twin – Integration of 1D, 2D, and 3D modeling and rapid overland flood routing.
- Anticipation – Early flood warning based on weather forecast, historical data, and flood mapping.
- Automate alerts – Customizable rules to trigger alerts and send automated notifications.
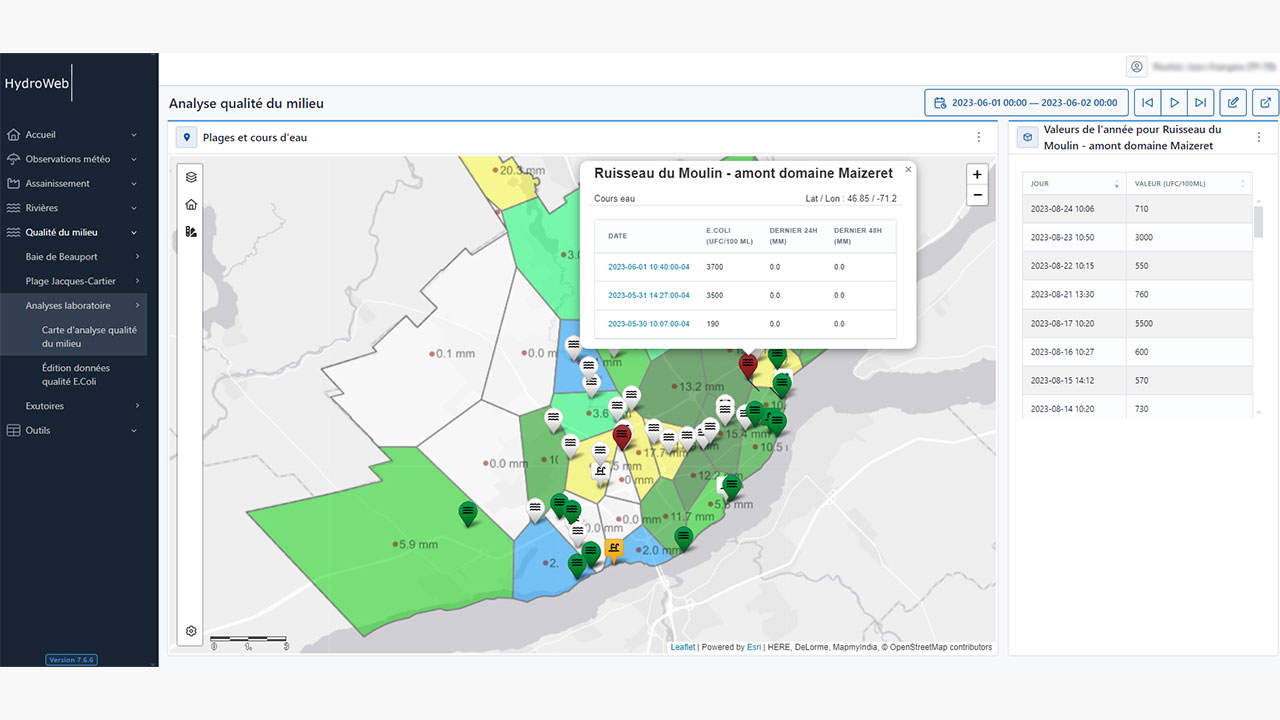
Water Quality
- Monitoring – Automate the collection, unification, and correlation of monitoring data.
- Assessment – Rapid water quality assessment, including percentile and Fundamental Intermittent Standards.
- Prediction – Automate the simulation of digital twins for predicting quality to generate early warning notifications.
- Quality Alert – Automated notification based on customizable rules.

Regulatory Reporting
- Visualization – Virtually mapping out monitoring and overflow locations.
- Validation – Ability to review, validate data, and add comments before report transmission.
- Overflow reporting – Improve production efficiency greatly with automated calculations of overflows frequency and duration for event duration monitoring. Automate the generation and transmission of reports to meet regulatory requirements.

Powered by AI
- Anomaly detection – Automate the detection of monitoring data anomaly with AI.
- Early detection – Quickly identify sensors needing attention to avoid impact on operation.
- Confidence – Increase the quality of data available for design and engineering.
- Prediction – Predict Combined Sewer Overflow (CSO) spills up to 12 or 24 hours in advance through machine learning.
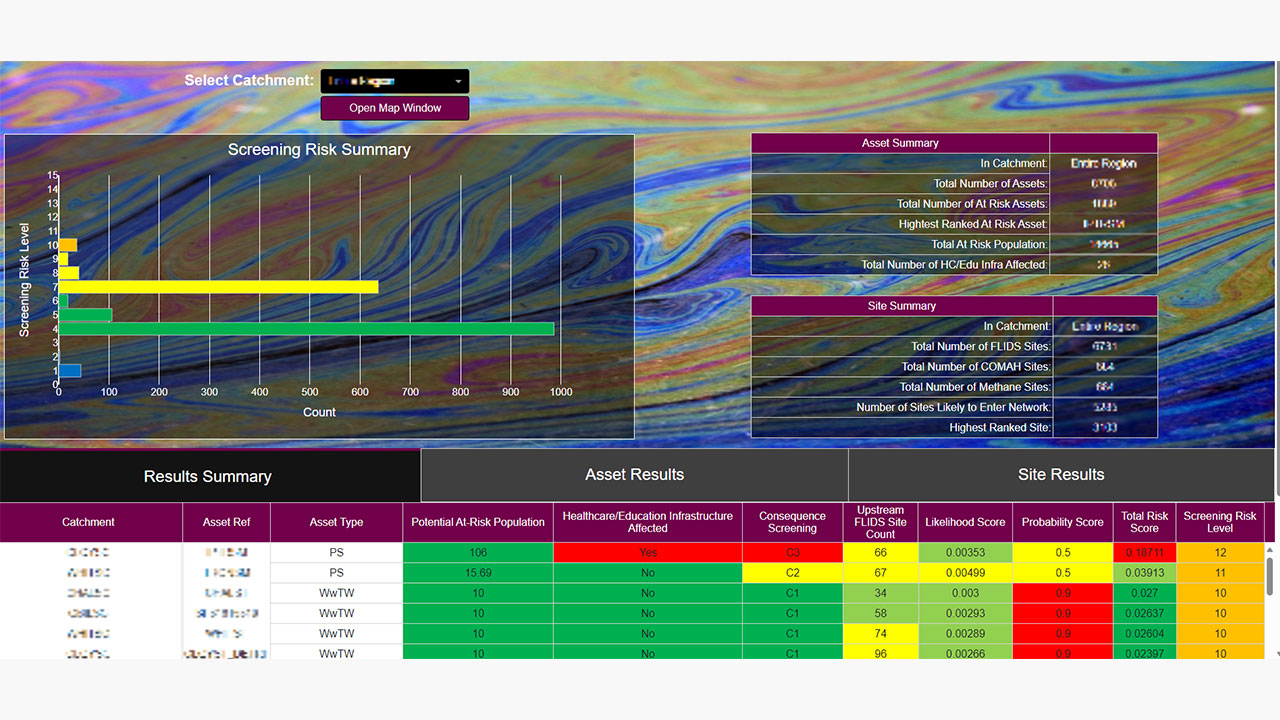
Asset Management
- Intuitive navigation – Visualize asset information in dynamic maps, images, tables, and charts.
- Condition and financial tracking – Communicates and provides an understanding of infrastructure investment plans. Tracks investment and funding progress, asset conditions over time.
- Failure assessment – Assess the consequence of failures for pump stations, sewers, and other assets.
- Predictive maintenance – Advanced analytics for data anomaly, alarms, and sediment accumulation detection to alert maintenance requirement and optimize maintenance planning.
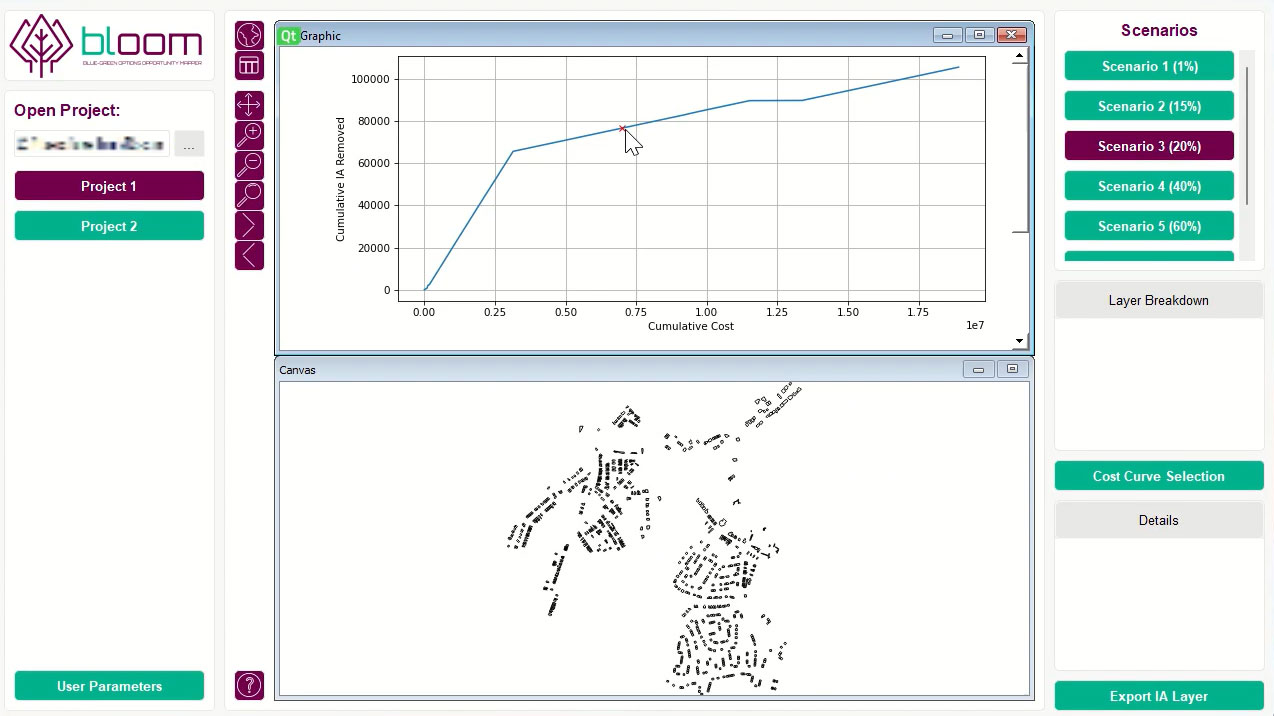
Stormwater and Natural Systems
- Identification – Automate the identification of best opportunities for sustainable drainage systems and nature-based solutions.
- Infiltration reduction – Identify opportunities based on modeled and historic data sources.
Surface water removal – Identify opportunities and calculate water removal benefits. - Optimization – Iterative storage optimizer and pass-forward flow time-series assessment to achieve flow control objectives effectively.
Reach out to our experts
- Automated rainfall statistics – Automate the process of post-event rainfall analysis including rainfall return periods.
- Real time storm tracking – Live updates and integrated graphic display of radar images, rain gauges, Thiessen polygons and Isohyetal.
- Data integration – Automate the process of data collection and unification of data from various sources into one single platform with georeferencing so data is contextualized efficiently.
- System performance tracking – Actively monitor and track system performance and using machine learning to classify flows and perform trend analysis to detect and address issues quickly.
- Storm impact prediction and analysis – Provide system level and flow predictions using digital twins and machine learning, automate correlation with rainfall and system data to analyze overall performance and predict pollution events.
- Integration of modeling tools – Automate model data validation, scenario modeling, solutions optimization and visualize results for analysis and comparison.
- Intuitive navigation – visualize asset information in dynamic maps, images, tables and charts.
- Condition and financial tracking – Communicates and provides understanding of infrastructure investment plans. Tracks investment and funding progress, asset conditions over time.
- Failure assessment – Assess the consequence of failures for pump stations, sewers and other assets.
- Predictive maintenance – advanced analytics for data anomaly, alarms, and sediment accumulation detection to alert maintenance requirement and optimize maintenance planning.
- Identification – Automate the identification of best opportunities for sustainable drainage systems and nature-based solutions.
- Infiltration reduction – identify opportunities based on modelled and historic data sources.
Surface water removal – identify opportunities and calculate water removal benefits. - Optimization – Iterative storage optimizer and pass-forward flow time-series assessment to achieve flow control objectives effectively.
- Reliable data – integration of real time monitoring data and video feeds for accurate representation.
- Digital twin – integration of 1D, 2D and 3D modeling and rapid overland flood routing.
Anticipation – Early flood warning based on weather forecast, historical data and flood mapping. - Automate alerts – customizable rules to trigger alerts and send automated notifications.
- Monitoring – automate the collection, unification and correlation of monitoring data.
- Assessment – rapid water quality assessment, including percentile and Fundamental Intermittent Standards.
- Prediction – automate the simulation of digital twin for predicting quality to generate early warning notifications.
- Quality Alert – automated notification based on customizable rules.
- Visualization – virtually mapping out monitoring and overflow locations.
- Validation – ability to review, validate data and add comments before report transmission.
- Overflow reporting – improve production efficiency greatly with automated calculations of overflows frequency and duration for event duration monitoring and automate the generation and transmission of report to meet regulatory requirements.
- Anomaly detection – automate the detection of monitoring data anomaly with AI
- Early detection – quickly identify sensors needing attention to avoid impact on operation.
- Confidence – Increase the quality of data available for design and engineering.
- Prediction – predict CSO spills up to 12 or 24 hours in advance through machine learning.